Plot
Examples#
Plot chromosome-level heatmap from contig-level mapping result#
- Convert pairs to cool file
- Adjust contig-level matrix to chromosome-level by agp file
Note
This function will generate two intermedia sample.10000.chrom.cool and sample.500k.chrom.cool.
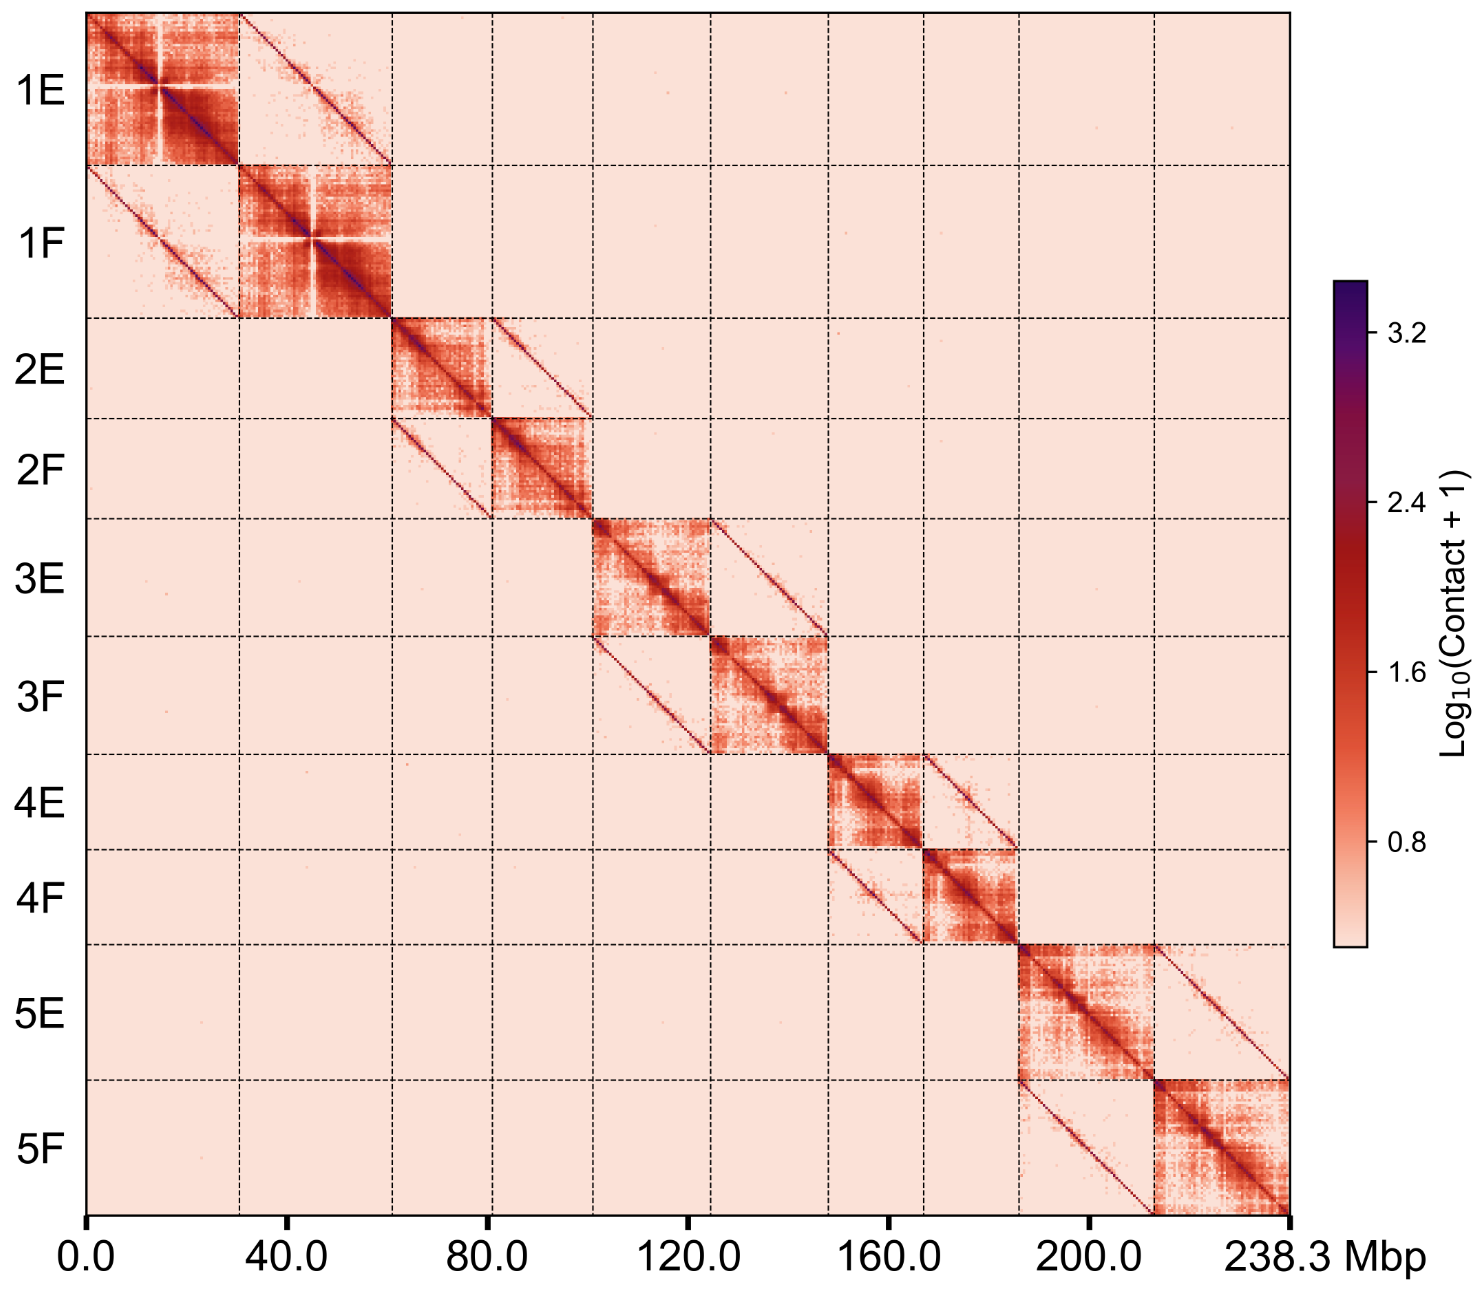
groups.500k.wg.png
Directly plot heatmap from .cool file#
Note
--binsize can be specified when you want to plot a larger resolution, e.g., 500k, plot will automatically generate a 1m matrix from the input matrix. Still, the binsize of the output matrix should be in integer multiples than the binsize of the input matrix.
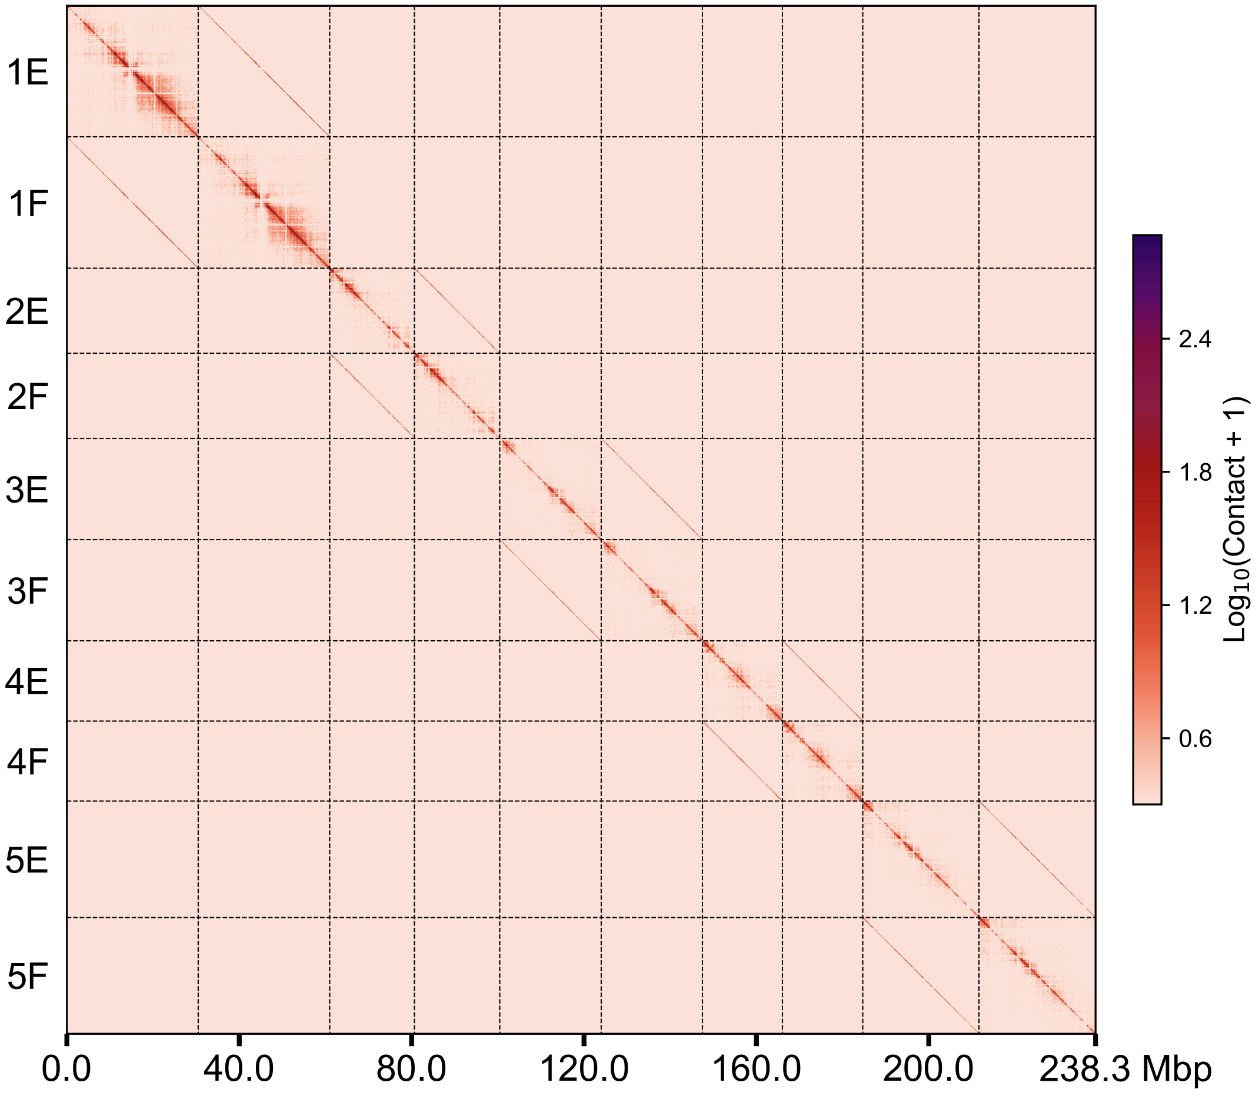
groups.100k.wg.png groups.500k.wg.png
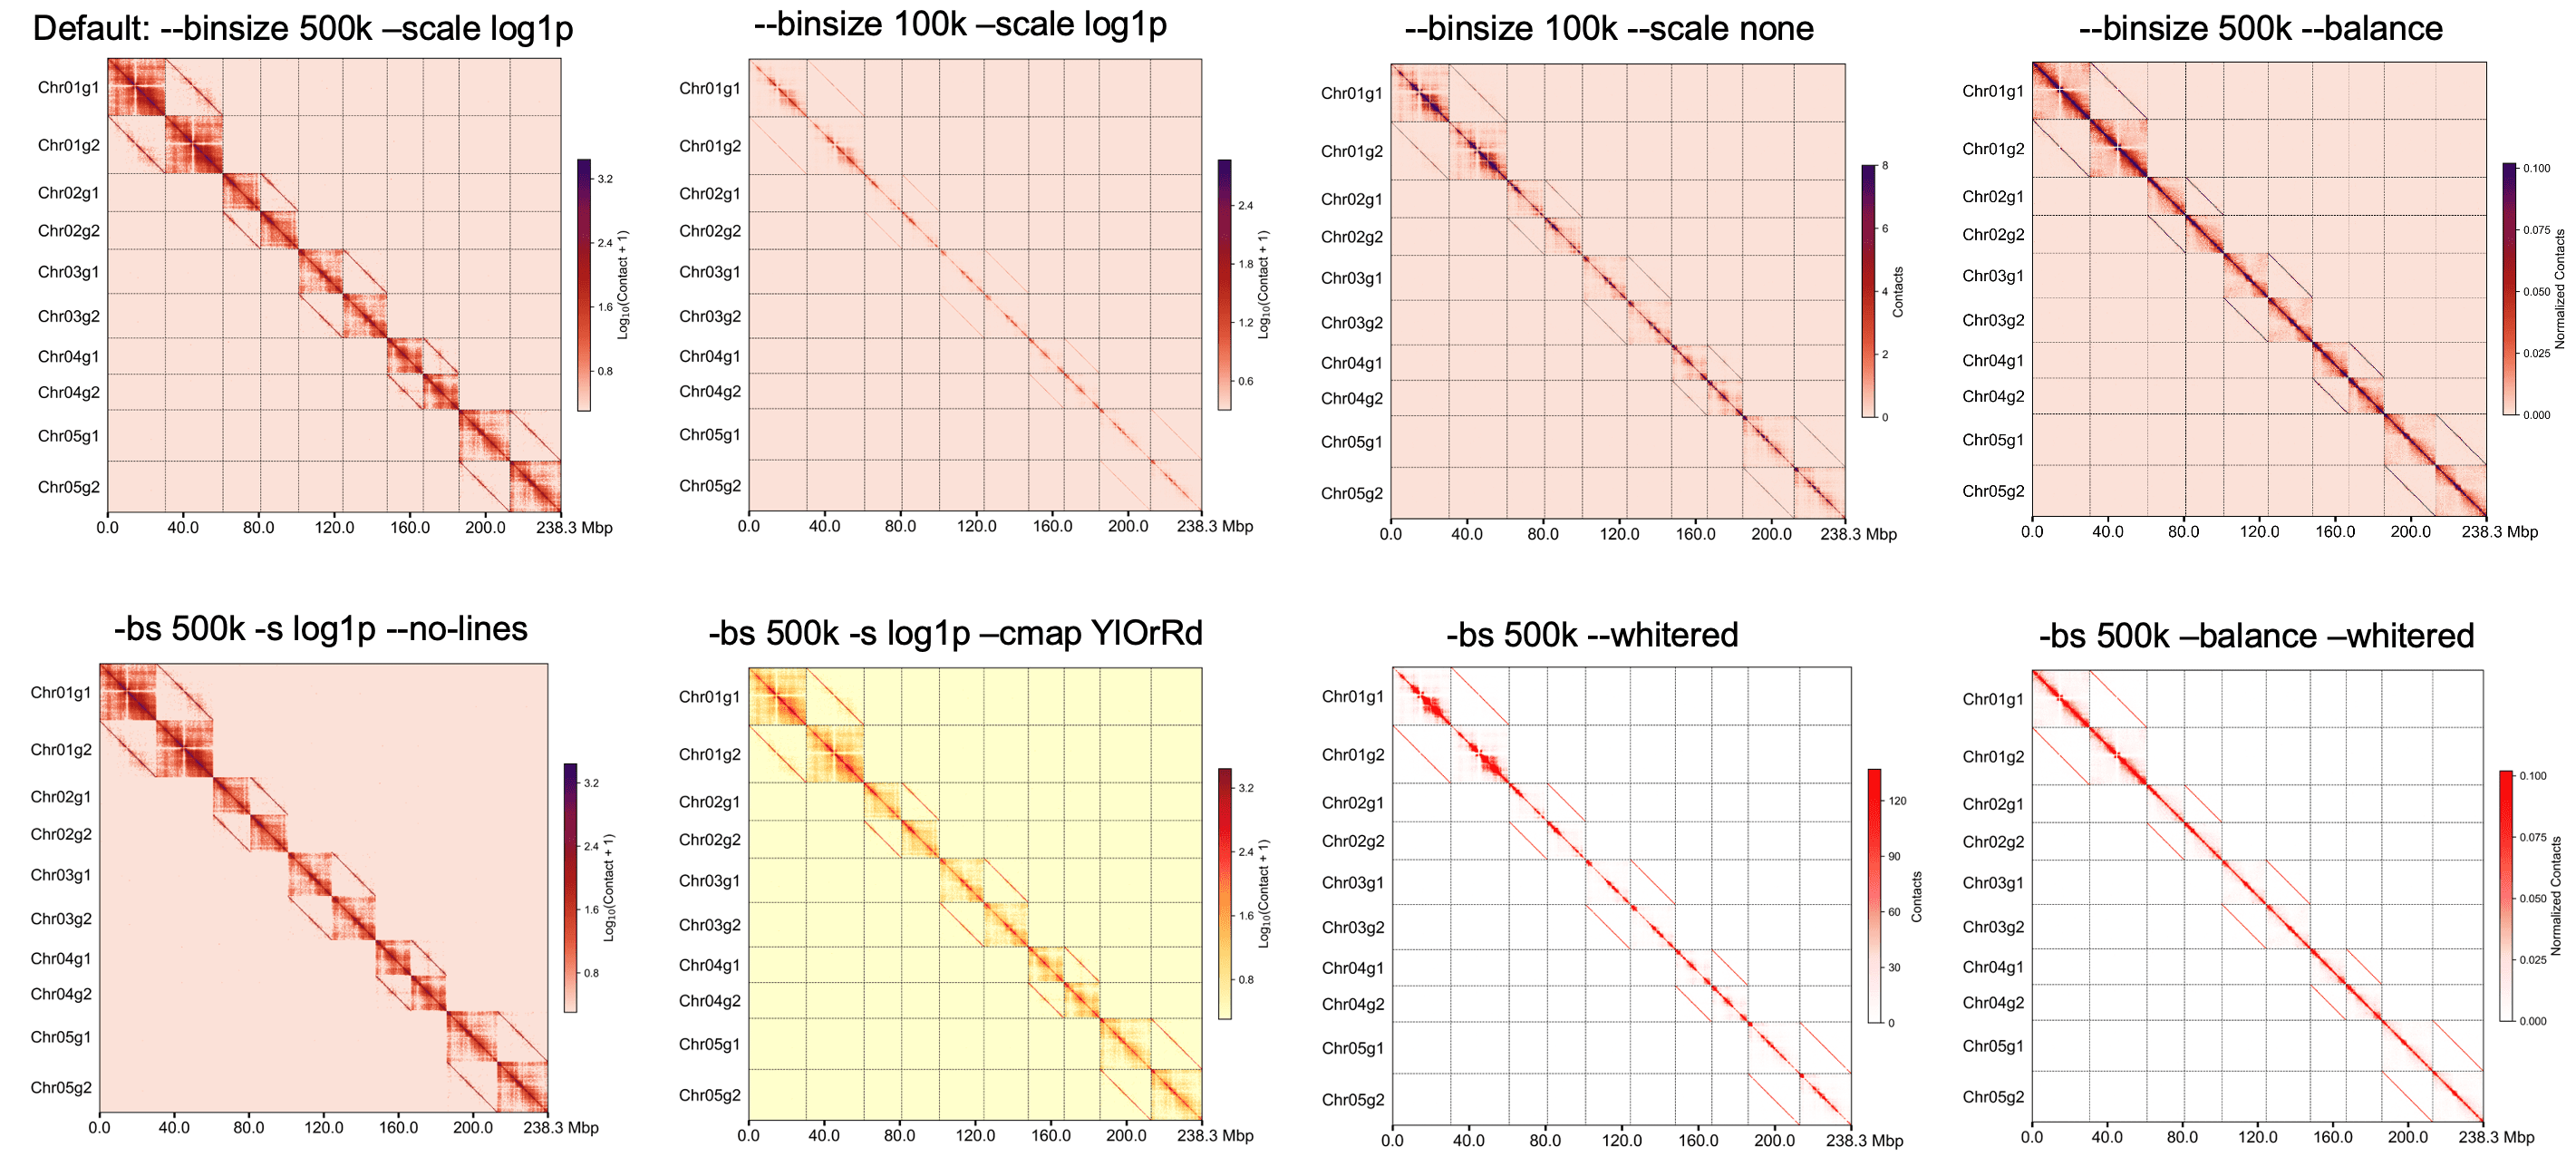
Gallery of different parameters#
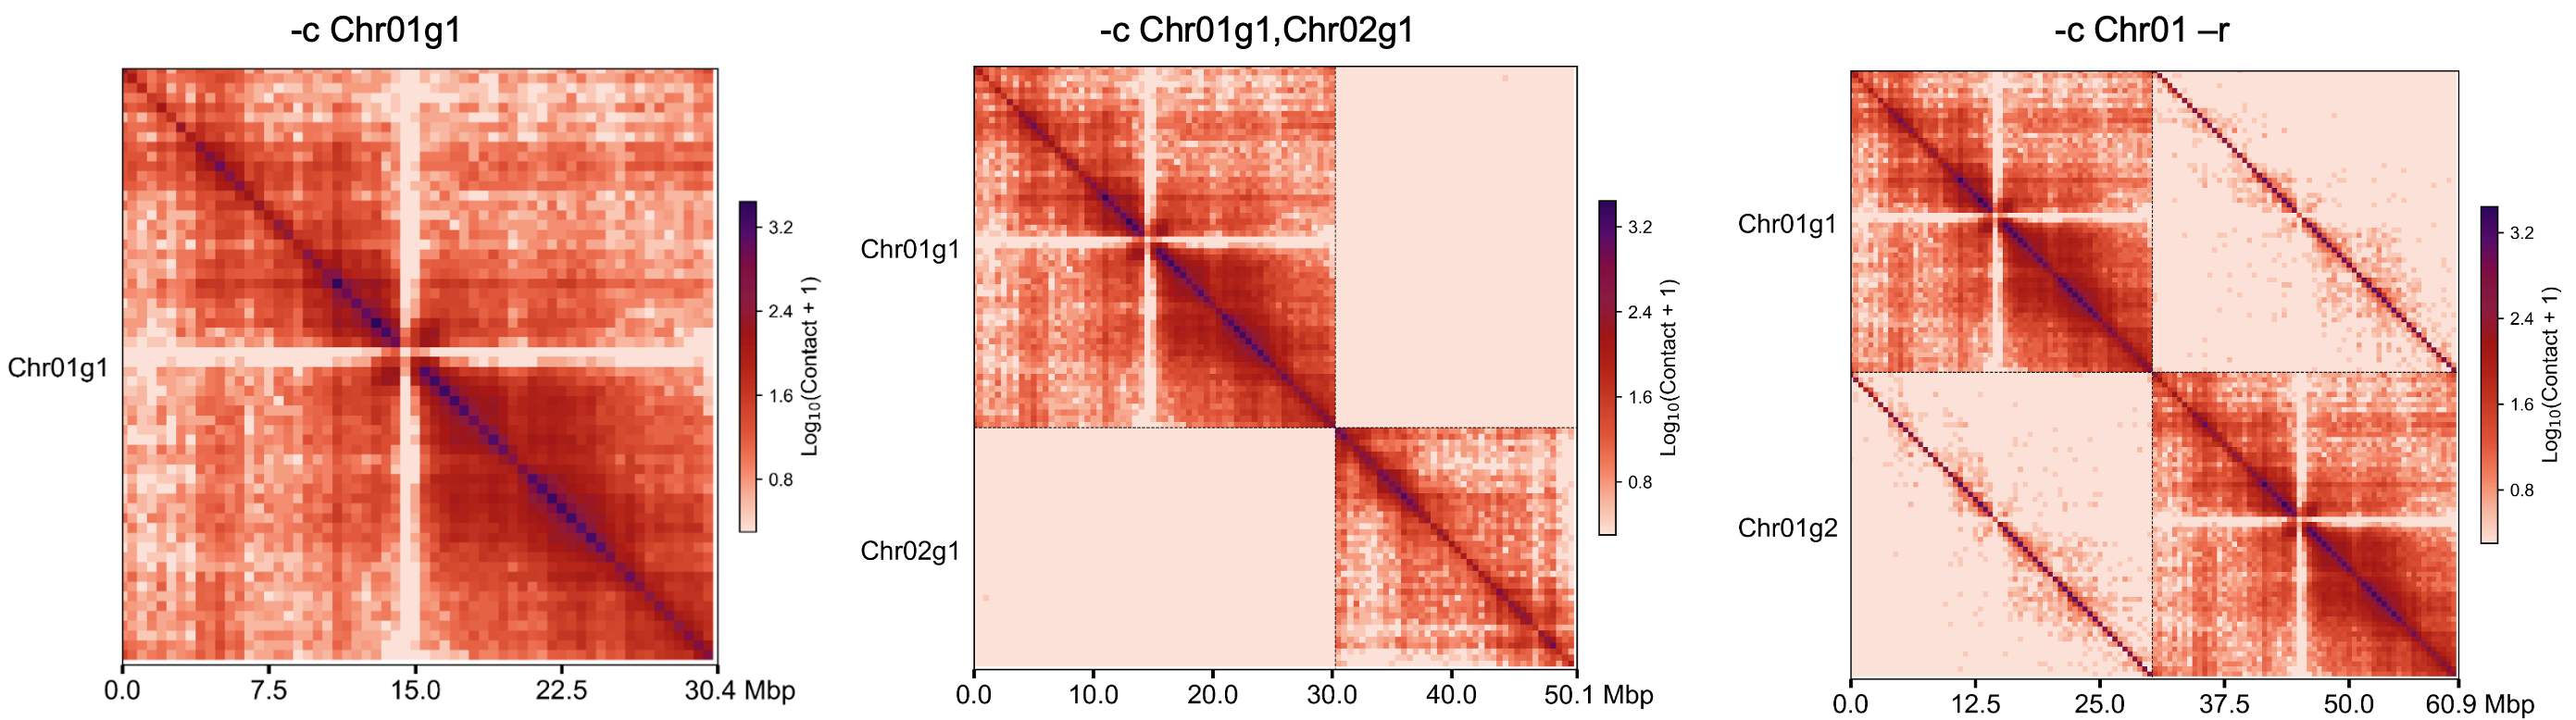
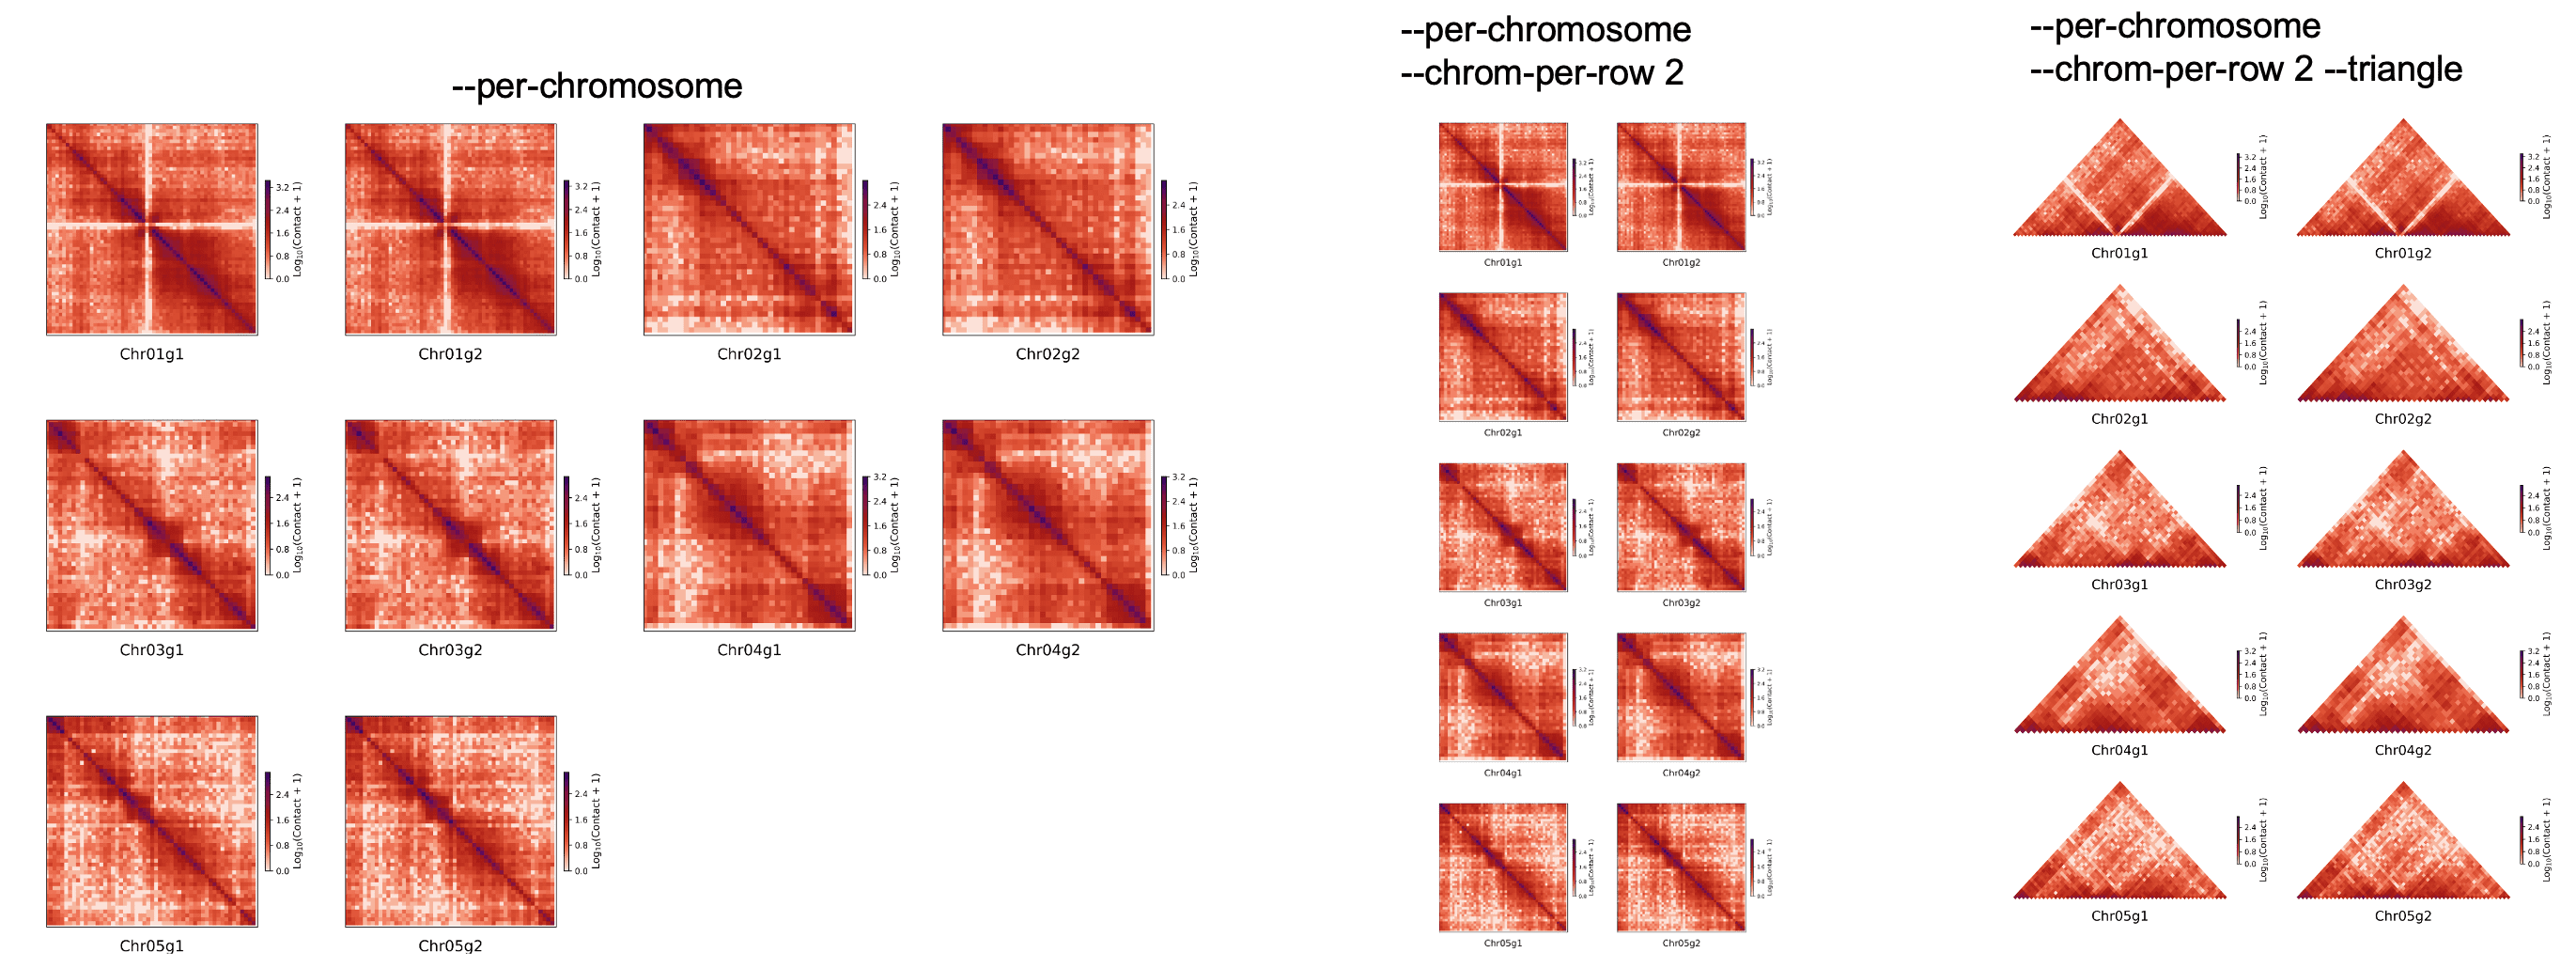
Plot specified chromosome#
Plot all chromosome split in one picture#
Parameters of plot#
cphasing plot -h
 Usage: cphasing plot [OPTIONS]

 Adjust or Plot the contacts matrix after assembling.

 ▌ Usage:
 ▌  • adjust the matrix by agp and plot a heatmap


  cphasing plot -a groups.agp -m sample.10000.cool -o groups.500k.wg.png


 ▌  • adjust the matrix by agp and plot a 100k resolution heatmap


  cphasing plot -a groups.agp \
      -m sample.10000.cool \
      -o groups.100k.wg.png \
      -bs 100k


 ▌  • only plot a heatmap


  cphasing plot -m sample.100k.cool -o sample.100k.png


 ▌  • Plot some chromosomes


  cphasing plot -m sample.100k.cool -c Chr01,Chr02 -o Chr01_Chr02.100k.png


╭─ Options of Matrix Operation ────────────────────────────────────────────╮
│ *  --matrix        -m   Contacts matrix stored by Cool format.           │
│                         (COOL)                                           │
│                         [required]                                       │
│    --binsize       -bs  Bin size of the heatmap you want to plot.        │
│                         Enabled suffix with k or m. [defalt: input       │
│                         matrix binsize]                                  │
│                         (STR)                                            │
│    --only-coarsen       Only coarsen the input matrix, do not need plot  │
│                         the heatmap.                                     │
│    --balance            balance the matrix.                              │
│    --balanced           Plot balanced values, which need cool have       │
│                         weights columns in bins.                         │
╰──────────────────────────────────────────────────────────────────────────╯
╭─ Options of AGP Adjustment ──────────────────────────────────────────────╮
│ --agp          -a  (AGP)                                                 │
│ --only-adjust      Only adjust the matrix by agp, do not need plot the   │
│                    heatmap.                                              │
╰──────────────────────────────────────────────────────────────────────────╯
╭─ Options of Heatmap ─────────────────────────────────────────────────────╮
│ --chromosomes                   -c         Chromosomes and order in      │
│                                            which the chromosomes should  │
│                                            be plotted. Comma seperated.  │
│                                            or a one column file          │
│                                            (TEXT)                        │
│ --regex                         -r         Regular expression of         │
│                                            chromosomes, only used for    │
│                                            --chromosomes, e.g. Chr01g.*  │
│ --disable-natural-sort          -dns       Disable natural sort of       │
│                                            chromosomes, only used for    │
│                                            --chromosomes or --only-chr   │
│ --per-chromosomes,--per-chrom…  -pc        Instead of plotting the whole │
│                                            matrix, each chromosome is    │
│                                            plotted next to the other.    │
│ --only-chr                      -oc        Only plot the chromosomes     │
│                                            that ignore unanchored        │
│                                            contigs. When --chromosomes   │
│                                            specifed, this parameter will │
│                                            be ignored. The default use   │
│                                            prefix of Chr to find the     │
│                                            chromosomes. --chr-prefix can │
│                                            be used to change this.       │
│ --chr-prefix                    -cp        Prefix of the chromosomes,    │
│                                            only used for --only-chr      │
│                                            (STR)                         │
│                                            [default: Chr]                │
│ --chrom-per-row                 -cpr       Number of chromosome plot in  │
│                                            each row                      │
│                                            (INTEGER)                     │
│                                            [default: 4]                  │
│ --vmin                          -vmin      (FLOAT)                       │
│ --vmax                          -vmax      (FLOAT)                       │
│ --scale                         -s         Method of contact             │
│                                            normalization                 │
│                                            (STR)                         │
│                                            [default: log1p]              │
│ --triangle                                 Plot the heatmap in triangle  │
│ --fontsize                                 Fontsize of the ticks,        │
│                                            default is auto               │
│                                            (INT)                         │
│ --dpi                           -dpi       Resolution for the image.     │
│                                            (INTEGER)                     │
│                                            [default: 600]                │
│ --cmap,--colormap               -cmap,-cm  Colormap of heatmap.          │
│                                            Available values can be seen  │
│                                            :                             │
│                                            https://pratiman-91.github.i… │
│                                            and                           │
│                                            http://matplotlib.org/exampl… │
│                                            and whitered .                │
│                                            (TEXT)                        │
│                                            [default: redp1_r]            │
│ --whitered                      -wr        Preset of --scale none        │
│                                            --colormap whitered           │
│ --no-lines                      -nl        Don't add dash line in        │
│                                            chromosome boundaries.        │
│ --no-ticks                      -nt        Don't add ticks both in x     │
│                                            axis and y axis.              │
│ --rotate-xticks                 -rx        Rotate the x ticks            │
│                                            [default: True]               │
│ --rotate-yticks                 -ry        Rotate the x ticks            │
╰──────────────────────────────────────────────────────────────────────────╯
╭─ Global Options ─────────────────────────────────────────────────────────╮
│ --output   -o        Output path of file.                                │
│                      (TEXT)                                              │
│                      [default: plot.heatmap.png]                         │
│ --threads  -t        Number of threads. Used in matrix balance.          │
│                      (INT)                                               │
│                      [default: 8]                                        │
│ --help     -help,-h  Show this message and exit.                         │
╰──────────────────────────────────────────────────────────────────────────╯